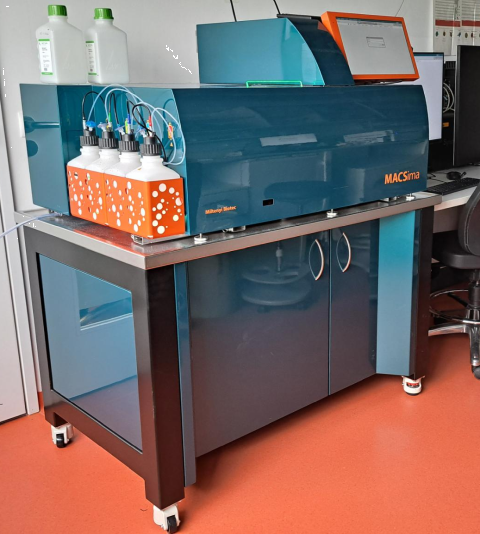
MACSima: Multiplex antibody-based imaging platform (N.C.02.034)
The MACSima from Miltenyi Biotech is a fully automated multiplex antibody-based imaging platform for cyclic immunofluorescence staining and imaging. This method allows detection of over a hundred proteins on the same tissue section so that defined cell subpopulations and target proteins can be identified. Importantly, this method also preserves sample integrity, so that the tissue section can be subjected to subsequent analyses. Despite the term "Spatial Biology" that is often used with such approaches, one image plane is recored per area, not 3D stacks. The system allows to analyze tissue sections with cellular resolution.
The MACSima is a fusion of a fluorescence microscope with a fluidics system that enables automated staining, image recording, bleaching of the fluorochromes, repeat. In each cycle, up to three fluorescent antibody signals (typically FITC, PE, APC) plus DAPI can be recorded. Off-the-shelf antibodies or self-labeled antibodies can be used. Which antibodies work may depend on the fixation method of the tissue. As an alternative to bleaching, Miltenyi offers an enzymatic release method that requires the use of patented antibodies (“REAlease” or “REAdyeLease”).
The platform comes with the Miltenyi MACS iQ view software for image analysis, including marker expression, cell segmentation, cell gating, unbiased clustering, dimensionality reduction, and distance analyses. This software is available on the MACSima itself, but also on our two analysis computers Leopold and Luitpold.
The system also allows mRNA detection, an approach that as of 2026 we did not yet explore.
Each project consists of the following steps:
1. Project design, including antibody panel design.
2. Preparation: Generation of histological sections and positioning them at the correct position on a slide. Getting the antibodies, testing antibodies on sections (optional).
3. The actual run on the MACSima.
4. Image analysis.
If you are interested in using the MACSima, you can make a “Request to discuss a MACSima project” in our booking software. Or contact the Core Facility Bioimaging.
Optics
The system has three objectives:
• 2×NA 0.1, to generate overview images and finding regions of interest.
• 20×NA 0.45. This is the standard objective that is used for most projects. It has a long working distance and thus can image through a standard glass slide (1 mm thick) from below.
• 20×NA 0.75. Same magnification but due to the higher numerical aperture with higher resolution and better fluorescence collection. Due to limitations set by physics, such an objective cannot have a large working distance. Thus special slides with only 170 μm thickness (cover glass thickness) have to be used.
Fluorescence excitation and detection
Several LEDs in the system create the following excitation wavelengths that are available for antibody based imaging: 386/23 nm, 470/40 nm, 531/46 nm, 628/32 nm. The corresponding emission filters are: 470/40 nm, 530/43 nm, 580/25 nm, 698/70 nm. Typically these are used to image Dapi, FITC, PE and APC. Other fluorochromes can be used but may need special attention to adjust bleaching times.
The above LEDs are not used for bleaching. Instead, a dedicated unit with 2 Watts intensity is used to bleach a 3 x 3 mm² area.
Automated stage
The automated stage allows to record a user defined region of interest (ROI) of any size by taking images at adjacent positions. Adjacent “tiles” will be automatically joined together to form one large, continuous image. Images from different cycles will be matched together ("registered") using the Dapi images.
It is possible to record multiple, non-adjacent ROIs. For example, tissue sections from different organs can be stained an imaged together.
Analysis software
The MACS iQ view software is available on the MACsima and also on two dedicated imaging workstations in the same room. It handles the following tasks (manufacturer's list):
• Easy display of hundreds of markers from high-dimensional datasets
• Fast and flexible segmentation
• Interactive gating
• Unbiased data analysis (k-means clustering, UMAP and t-SNE calculation)
• Multiple plotting options (histogram, scatter plot, strip and violin plots, heatmaps)
• Workflow editor
• Distance analyses
It is possible to export images, perform cell segmentation in a separate software and import the segmentation results, to use further convenient features of the software, such as easy display of multiple markers, analysis by histocytometry (flow sorter like gating of cells).